Trend Analysis
Summary of Trend Analysis Report in LoadOps
Overview
This section, located under the Reporting section of LoadOps, provides visual chart reporting capabilities over a certain date range. We report the past 1 year as the default, but this date range can be modified to match your needs. Data is updated and reflected in this section daily so that you can explore trends by week or by month.
The dates shown on the Weekly Report are based on the Work Week Start Day set within Settings > Preferences> Misc Settings. Monday is the value by default.
Workflow: Please follow the adjacent link on how to work with Trend Analysis: Trend Analysis
Filters
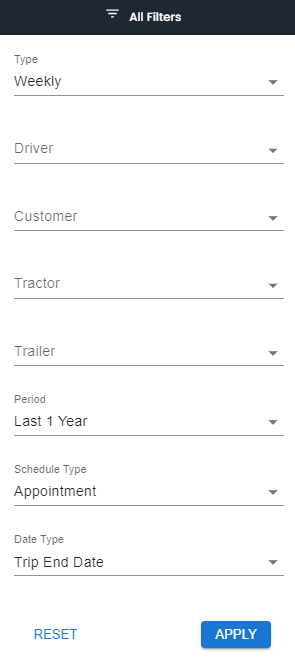
You can filter the data by Type (weekly or monthly) and by Period (Last 1 Year, 2 Years, and Whole Period)

You can also click on All Filters to filter the data by Driver, Customer, Tractor, Trailer, Schedule Type, and Date Type.
Sorting
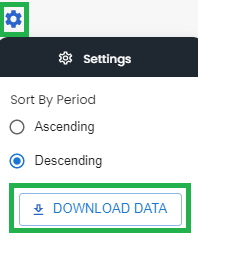
Clicking the Sort arrow to the right of the Period filter sorts all charts in ascending or descending order.

Charts
The list below includes the current charts available to help you analyze your data within LoadOps. You can find an example of each chart below the list of charts.
- Mileage KPIs
- Trip miles
- Empty miles
- Number of Loads
Each of these examples is the weekly report. You can switch to view a monthly view by selecting the Monthly option filter within LoadOps.


